Lawyer Salary in California: $208,615 (2026)
Quick Answer:Across California's 158 metropolitan areas, the average median lawyer pay sits at $208,615/year heading into 2026 — a figure projected from 2025 BLS OEWS wage data for SOC 23-1011. Because California sits at BEA RPP 113.1 (13% above the U.S. baseline), that statewide median translates to roughly $184,452 in nationally-comparable purchasing power. Highest-paying metros: Sunnyvale ($308,395), Santa Clara ($306,370), San Jose ($301,320).
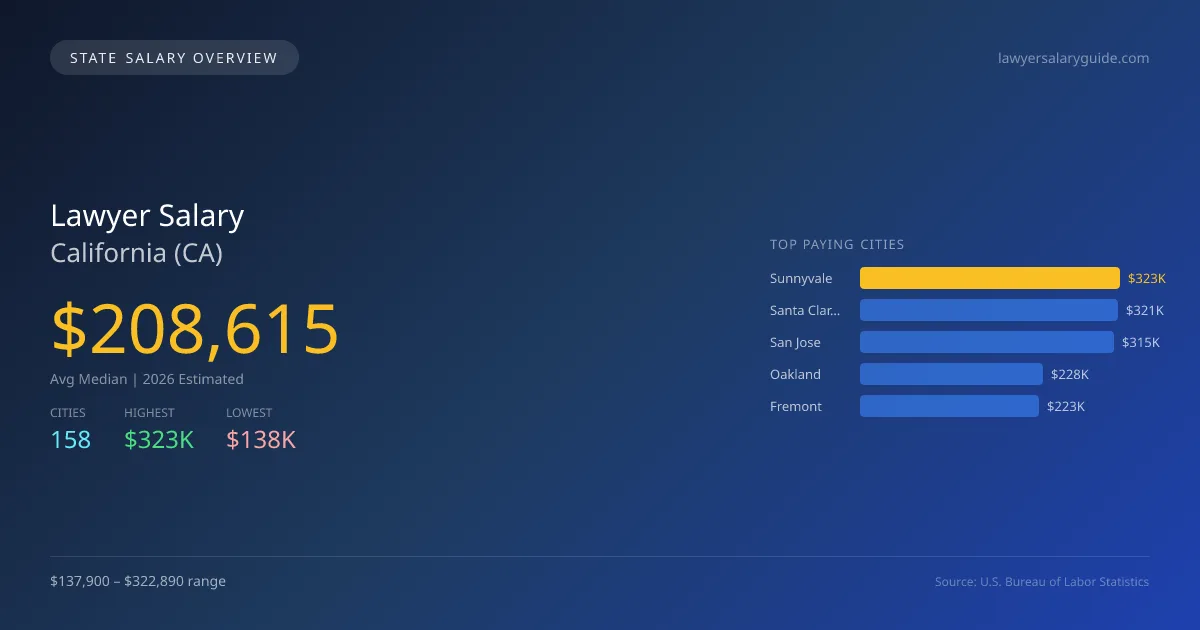
In 2026, the average median salary for lawyers in California is projected to be $208,615, which is significantly above the national median of $167,174, reflecting a 24.8% increase. The disparity in salaries across the state is notable, with Sunnyvale leading at $322,890, while Chico offers the lowest at $137,900, resulting in a gap of $184,990. This variance is driven by factors such as the concentration of high-tech companies and corporate law firms in areas like Silicon Valley, which creates a higher demand for specialized legal services. California’s licensing requirements are stringent, requiring passing the California Bar Exam, which ensures a high standard of practice. Additionally, the state’s diverse economy and vibrant industries, such as technology, entertainment, and real estate, significantly enhance the demand for legal professionals. As of 2026, California is expected to employ 92,774 lawyers, with a projected annual growth rate of 4.70% in legal jobs. As the legal landscape continues to evolve with emerging industries and complex regulations, opportunities for lawyers in the state remain strong, making it a key market for legal professionals seeking advancement in their careers.
California Lawyer Salary Range
Overall salary range in California: $58,904 (lowest entry-level) to $500,479 (highest top earner)
California vs National Average
California lawyers earn 24.79% more than the national median (+$41,441/year difference).
California Lawyer Salary Distribution (2026)
Lawyer salaries in California range from $100,520 (entry-level, 10th percentile) to $372,221 (top earners, 90th percentile), with a median of $208,615. The California median is $41,441 above the US national median of $167,174. The average hourly rate is $100.30/hr. Approximately 92,774 lawyers are employed across 158 cities.
2019 BLS Actual
$158,139
2025 BLS Actual
$199,250
2026 Current Est.
$208,615
2019–2027 Growth
+38.1%
Salary Trajectory for Lawyers in California (2019–2027)
2019–2025: actual BLS OEWS data for this metro area. 2026+: CAGR 4.70% projection.
| Year | Annual Salary | Status |
|---|---|---|
| 2019 | $158,139 | Actual |
| 2020 | $159,363 | Actual |
| 2021 | $159,233 | Actual |
| 2022 | $180,856 | Actual |
| 2023 | $188,933 | Actual |
| 2024 | $198,809 | Actual |
| 2025 | $199,250 | Actual |
| 2026(current) | $208,615 | Estimated |
| 2027 | $218,419 | Projected |
Based on 7 years of BLS OEWS data for the California metropolitan area, the median lawyer salary grew 26.0% from $158,139 (2019) to $199,250 (2025). At a 4.70% compound annual growth rate, salaries are projected to reach $218,419 by 2027 — a total increase of $60,280 (38.12%) from 2019.
Note: Historical values (2019–2025) are actual BLS OEWS figures for the California metropolitan area, sourced from annual Occupational Employment and Wage Statistics surveys. 2026–2026 figures are current estimates, and 2027 values are projections, calculated using a 4.70% CAGR derived from 7-year BLS historical data. Actual salaries may vary based on employer, experience, certifications, and local market conditions.
Top 5 Highest Paying Cities in California
Lowest Paying Cities in California
Best Value Cities for Lawyers in California
When adjusted for local cost of living, these California cities offer the most purchasing power for lawyers.
| City | Nominal Salary | CoL Index | Adjusted Salary |
|---|---|---|---|
| San Jose | $315,482 | 110.423 | $285,703 |
| Sunnyvale | $322,890 | 113.1 | $285,491 |
| Santa Clara | $320,769 | 113.1 | $283,615 |
| Oakland | $227,551 | 113.1 | $201,195 |
| Fremont | $222,533 | 113.1 | $196,758 |
Adjusted salary = nominal salary × (100 / CoL index). CoL index: 100 = national average. Lower index = lower cost of living.
Salary by Experience Level in California
| Experience Level | Estimated Annual |
|---|---|
| Entry Level (0-2 years) | $100,520 |
| Mid Career (3-7 years) | $208,615 |
| Experienced (7+ years) | $372,221 |
Estimates based on BLS percentile data averaged across California metro areas. Individual pay varies by employer, certifications, and specialization.
All 158 Cities in California
| # | City | Median Salary |
|---|---|---|
| 1 | Sunnyvale | $322,890 |
| 2 | Santa Clara | $320,769 |
| 3 | San Jose | $315,482 |
| 4 | Oakland | $227,551 |
| 5 | Fremont | $222,533 |
| 6 | San Francisco | $222,487 |
| 7 | Anaheim | $207,170 |
| 8 | Long Beach | $204,223 |
| 9 | Los Angeles | $203,547 |
| 10 | Oxnard | $194,239 |
| 11 | Thousand Oaks | $193,454 |
| 12 | Santa Rosa | $190,093 |
| 13 | Petaluma | $188,276 |
| 14 | Folsom | $188,195 |
| 15 | Sacramento | $186,931 |
| 16 | Chula Vista | $186,813 |
| 17 | San Diego | $186,596 |
| 18 | Santa Ana | $186,180 |
| 19 | Roseville | $186,161 |
| 20 | Carlsbad | $185,036 |
| 21 | San Luis Obispo | $184,042 |
| 22 | Riverside | $183,891 |
| 23 | Stockton | $183,099 |
| 24 | Fontana | $182,734 |
| 25 | Irvine | $182,533 |
| 26 | Pomona | $181,642 |
| 27 | Simi Valley | $181,542 |
| 28 | Escondido | $181,501 |
| 29 | San Bernardino | $181,214 |
| 30 | Fairfield | $181,174 |
| 31 | Lodi | $180,573 |
| 32 | Fullerton | $180,507 |
| 33 | Daly City | $180,350 |
| 34 | El Monte | $180,293 |
| 35 | Vista | $180,194 |
| 36 | Concord | $180,151 |
| 37 | Clovis | $179,882 |
| 38 | Ontario | $179,867 |
| 39 | Garden Grove | $179,698 |
| 40 | Temecula | $179,655 |
| 41 | Santa Clarita | $179,534 |
| 42 | Lancaster | $179,300 |
| 43 | Inglewood | $179,300 |
| 44 | Corona | $179,073 |
| 45 | Richmond | $179,044 |
| 46 | Santa Maria | $179,006 |
| 47 | Rialto | $178,958 |
| 48 | Torrance | $178,731 |
| 49 | Vallejo | $178,545 |
| 50 | Elk Grove | $178,391 |
| 51 | Oceanside | $178,348 |
| 52 | Whittier | $178,296 |
| 53 | San Rafael | $178,282 |
| 54 | Rancho Cucamonga | $178,121 |
| 55 | Hayward | $178,021 |
| 56 | Woodland | $177,975 |
| 57 | Buena Park | $177,948 |
| 58 | Encinitas | $177,935 |
| 59 | Downey | $177,922 |
| 60 | Dublin | $177,822 |
| 61 | Redlands | $177,767 |
| 62 | Chino | $177,670 |
| 63 | Westminster | $177,614 |
| 64 | Santa Monica | $177,601 |
| 65 | San Mateo | $177,582 |
| 66 | Tulare | $177,530 |
| 67 | San Buenaventura | $177,469 |
| 68 | Mission Viejo | $177,349 |
| 69 | Moreno Valley | $177,348 |
| 70 | Pleasanton | $177,322 |
| 71 | Pasadena | $177,071 |
| 72 | Santee | $176,946 |
| 73 | Glendale | $176,787 |
| 74 | Mountain View | $176,696 |
| 75 | Pittsburg | $176,681 |
| 76 | Napa | $176,650 |
| 77 | Novato | $176,626 |
| 78 | Costa Mesa | $176,560 |
| 79 | Berkeley | $176,374 |
| 80 | Huntington Beach | $176,333 |
| 81 | Jurupa Valley | $176,176 |
| 82 | Hemet | $176,125 |
| 83 | Union City | $176,111 |
| 84 | West Covina | $176,091 |
| 85 | Chino Hills | $176,042 |
| 86 | Gilroy | $175,791 |
| 87 | San Marcos | $175,694 |
| 88 | Tustin | $175,540 |
| 89 | San Ramon | $175,526 |
| 90 | Eastvale | $175,360 |
| 91 | Murrieta | $175,353 |
| 92 | Vacaville | $175,353 |
| 93 | Brentwood | $175,276 |
| 94 | Hesperia | $175,192 |
| 95 | Lake Elsinore | $175,179 |
| 96 | Citrus Heights | $174,956 |
| 97 | El Cajon | $174,799 |
| 98 | Salinas | $174,786 |
| 99 | San Clemente | $174,747 |
| 100 | Bellflower | $174,677 |
| 101 | Palmdale | $174,600 |
| 102 | La Mirada | $174,599 |
| 103 | Apple Valley | $174,566 |
| 104 | Menifee | $174,515 |
| 105 | Yucaipa | $174,441 |
| 106 | Norwalk | $174,430 |
| 107 | Rancho Cordova | $174,274 |
| 108 | Montebello | $174,107 |
| 109 | Compton | $174,038 |
| 110 | Porterville | $173,912 |
| 111 | Lompoc | $173,890 |
| 112 | Hawthorne | $173,620 |
| 113 | Antioch | $173,563 |
| 114 | Burbank | $173,550 |
| 115 | Alhambra | $173,147 |
| 116 | Livermore | $173,147 |
| 117 | Orange | $173,095 |
| 118 | South Gate | $173,091 |
| 119 | Victorville | $173,052 |
| 120 | West Sacramento | $172,994 |
| 121 | Poway | $172,949 |
| 122 | San Leandro | $172,715 |
| 123 | Santa Cruz | $172,535 |
| 124 | Indio | $172,520 |
| 125 | Lake Forest | $172,520 |
| 126 | Carson | $172,215 |
| 127 | Rocklin | $172,186 |
| 128 | Newport Beach | $171,894 |
| 129 | Redwood City | $171,881 |
| 130 | Turlock | $171,839 |
| 131 | Manteca | $171,782 |
| 132 | Perris | $171,769 |
| 133 | Modesto | $171,718 |
| 134 | Madera | $171,629 |
| 135 | Baldwin Park | $171,324 |
| 136 | Palo Alto | $171,324 |
| 137 | Lakewood | $171,254 |
| 138 | Beaumont | $170,753 |
| 139 | Tracy | $170,711 |
| 140 | Alameda | $170,656 |
| 141 | Laguna Niguel | $170,614 |
| 142 | Milpitas | $170,530 |
| 143 | Fresno | $170,326 |
| 144 | El Centro | $170,221 |
| 145 | Camarillo | $170,169 |
| 146 | Oakley | $170,099 |
| 147 | Davis | $170,057 |
| 148 | Upland | $169,932 |
| 149 | La Habra | $169,681 |
| 150 | Lynwood | $169,612 |
| 151 | Brea | $166,717 |
| 152 | Bakersfield | $157,992 |
| 153 | Visalia | $157,197 |
| 154 | Hanford | $156,453 |
| 155 | Yuba City | $146,276 |
| 156 | Merced | $145,543 |
| 157 | Redding | $140,193 |
| 158 | Chico | $137,900 |
More California Salary Data
Compare Cities in California
View all comparisons →Explore More Lawyer Salary Data
Frequently Asked Questions
How much do lawyers make in California in 2026?
What is the highest paying city for lawyers in California?
How does California lawyer pay compare to the national average?
What is the entry-level lawyer salary in California?
How many lawyers are employed in California?
Which California city offers the best value for lawyers?
Written by Alexandra Chen, JD
Career Analyst
Alexandra has 10 years of experience in corporate law. She specializes in mergers and acquisitions. Alexandra works at a mid-sized law firm in New York City.
Methodology & Data Source
Statewide salary figures on this page are 2026 projections based on the Bureau of Labor Statistics Occupational Employment and Wage Statistics (OEWS) survey, May 2026 release. A 4.70% compound annual growth rate (CAGR), derived from 6-year national BLS wage trends, was applied to each metro area's reported salary to estimate current 2026 lawyer compensation across California. State averages are employment-weighted across 158 metro areas — larger metro areas with more lawyerscontribute proportionally more to the average, producing figures that better reflect typical compensation. Individual pay varies by city, employer, certifications, and experience.
Data Sources & Methodology
Source: BLS, OEWS, 7-year dataset (–). Per-city data from annual BLS metropolitan area surveys.
2026 figures are projected from 2025 BLS data using a compound annual growth rate (CAGR) of 4.70%, derived from historical BLS wage trends for lawyers (SOC 23-1011).
Compiled and verified by Alexandra Chen, JD, a licensed lawyer with 10+ years of clinical experience. · View source data at BLS.gov