Lawyer Salary in Washington: $164,206 (2026)
Quick Answer:Across Washington's 50 metropolitan areas, the average median lawyer pay sits at $164,206/year heading into 2026 — a figure projected from 2025 BLS OEWS wage data for SOC 23-1011. Because Washington sits at BEA RPP 107.4 (7% above the U.S. baseline), that statewide median translates to roughly $152,892 in nationally-comparable purchasing power. Highest-paying metros: Bellevue ($166,597), Seattle ($164,980), Tacoma ($162,228).
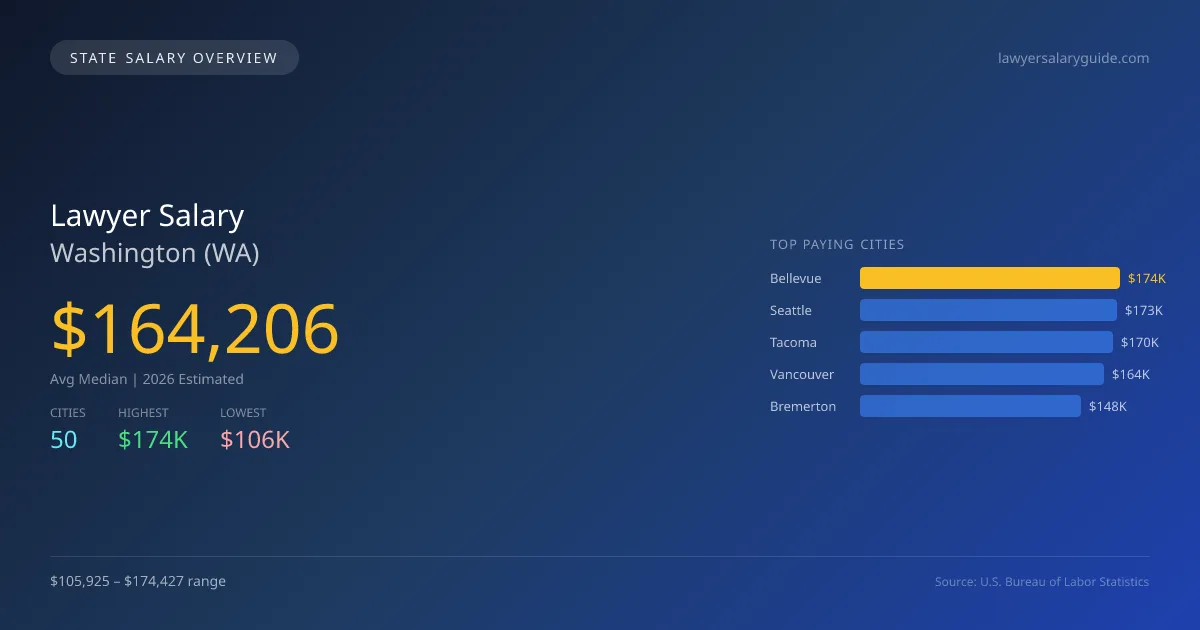
In Washington, the average median salary for lawyers in 2026 is projected at $164,206, which is slightly below the national median of $167,174, reflecting a difference of -1.8%. The highest paying city is Bellevue, with an estimated salary of $174,427, while Longview represents the lowest at $105,925. This nearly $68,502 gap can be attributed to various factors, such as the concentration of large law firms and corporate headquarters in urban areas like Bellevue and Seattle, which drives demand and raises salaries. Washington mandates specific state licensing requirements and enforces laws regarding the scope of practice for attorneys, impacting earnings potential. The demand for legal services in the state, fueled by population growth and evolving legal needs, supports job market strength, projecting an annual growth rate of 4.70% for lawyers. Major cities like Seattle ($172,734), Tacoma ($169,853), and Vancouver ($163,678) also reflect strong salary offerings that align with the increased demand for legal expertise. As the legal landscape continues to develop, Washington remains an important state for aspiring lawyers considering their career paths.
Washington Lawyer Salary Range
Overall salary range in Washington: $74,421 (lowest entry-level) to $328,884 (highest top earner)
Washington vs National Average
Washington lawyers earn 1.78% less than the national median ($-2,968/year difference).
Washington Lawyer Salary Distribution (2026)
Lawyer salaries in Washington range from $100,294 (entry-level, 10th percentile) to $300,221 (top earners, 90th percentile), with a median of $164,206. The Washington median is $2,968 below the US national median of $167,174. The average hourly rate is $78.95/hr. Approximately 12,180 lawyers are employed across 50 cities.
2019 BLS Actual
$112,847
2025 BLS Actual
$156,835
2026 Current Est.
$164,206
2019–2027 Growth
+52.4%
Salary Trajectory for Lawyers in Washington (2019–2027)
2019–2025: actual BLS OEWS data for this metro area. 2026+: CAGR 4.70% projection.
| Year | Annual Salary | Status |
|---|---|---|
| 2019 | $112,847 | Actual |
| 2020 | $116,289 | Actual |
| 2021 | $122,879 | Actual |
| 2022 | $133,610 | Actual |
| 2023 | $113,877 | Actual |
| 2024 | $154,457 | Actual |
| 2025 | $156,835 | Actual |
| 2026(current) | $164,206 | Estimated |
| 2027 | $171,924 | Projected |
Based on 7 years of BLS OEWS data for the Washington metropolitan area, the median lawyer salary grew 39.0% from $112,847 (2019) to $156,835 (2025). At a 4.70% compound annual growth rate, salaries are projected to reach $171,924 by 2027 — a total increase of $59,077 (52.35%) from 2019.
Note: Historical values (2019–2025) are actual BLS OEWS figures for the Washington metropolitan area, sourced from annual Occupational Employment and Wage Statistics surveys. 2026–2026 figures are current estimates, and 2027 values are projections, calculated using a 4.70% CAGR derived from 7-year BLS historical data. Actual salaries may vary based on employer, experience, certifications, and local market conditions.
Top 5 Highest Paying Cities in Washington
Lowest Paying Cities in Washington
| City | Median Salary |
|---|---|
| Longview | $105,925 |
| Tukwila | $128,311 |
| Mountlake Terrace | $128,510 |
| Spokane | $129,702 |
| Covington | $130,315 |
Best Value Cities for Lawyers in Washington
When adjusted for local cost of living, these Washington cities offer the most purchasing power for lawyers.
| City | Nominal Salary | CoL Index | Adjusted Salary |
|---|---|---|---|
| Bellevue | $174,427 | 107.4 | $162,409 |
| Tacoma | $169,853 | 107.4 | $158,150 |
| Seattle | $172,734 | 111.133 | $155,430 |
| Vancouver | $163,678 | 107.4 | $152,400 |
| Walla Walla | $143,429 | 98.519 | $145,585 |
Adjusted salary = nominal salary × (100 / CoL index). CoL index: 100 = national average. Lower index = lower cost of living.
Salary by Experience Level in Washington
| Experience Level | Estimated Annual |
|---|---|
| Entry Level (0-2 years) | $100,294 |
| Mid Career (3-7 years) | $164,206 |
| Experienced (7+ years) | $300,221 |
Estimates based on BLS percentile data averaged across Washington metro areas. Individual pay varies by employer, certifications, and specialization.
All 50 Cities in Washington
| # | City | Median Salary |
|---|---|---|
| 1 | Bellevue | $174,427 |
| 2 | Seattle | $172,734 |
| 3 | Tacoma | $169,853 |
| 4 | Vancouver | $163,678 |
| 5 | Bremerton | $148,192 |
| 6 | Richland | $144,922 |
| 7 | Walla Walla | $143,429 |
| 8 | Renton | $142,442 |
| 9 | Kennewick | $141,963 |
| 10 | Everett | $141,062 |
| 11 | Tumwater | $140,420 |
| 12 | Marysville | $140,007 |
| 13 | Shoreline | $139,237 |
| 14 | Olympia | $139,146 |
| 15 | Redmond | $138,687 |
| 16 | Kent | $138,573 |
| 17 | Wenatchee | $138,487 |
| 18 | Kirkland | $138,346 |
| 19 | Burien | $138,170 |
| 20 | Lacey | $138,005 |
| 21 | Yakima | $137,848 |
| 22 | Bellingham | $137,660 |
| 23 | Federal Way | $137,563 |
| 24 | Des Moines | $137,534 |
| 25 | Auburn | $137,214 |
| 26 | Lakewood | $137,159 |
| 27 | Issaquah | $137,082 |
| 28 | Sammamish | $136,180 |
| 29 | University Place | $136,133 |
| 30 | SeaTac | $136,025 |
| 31 | Pasco | $135,444 |
| 32 | Mount Vernon | $135,035 |
| 33 | Edmonds | $134,614 |
| 34 | Lake Stevens | $134,259 |
| 35 | Lynnwood | $134,173 |
| 36 | Moses Lake | $133,914 |
| 37 | Bothell | $133,817 |
| 38 | Pullman | $133,224 |
| 39 | Puyallup | $132,923 |
| 40 | Ellensburg | $132,424 |
| 41 | Spokane Valley | $132,197 |
| 42 | Maple Valley | $132,061 |
| 43 | Camas | $131,727 |
| 44 | Oak Harbor | $131,171 |
| 45 | Kenmore | $130,325 |
| 46 | Covington | $130,315 |
| 47 | Spokane | $129,702 |
| 48 | Mountlake Terrace | $128,510 |
| 49 | Tukwila | $128,311 |
| 50 | Longview | $105,925 |
More Washington Salary Data
Compare Cities in Washington
View all comparisons →Explore More Lawyer Salary Data
Frequently Asked Questions
How much do lawyers make in Washington in 2026?
What is the highest paying city for lawyers in Washington?
How does Washington lawyer pay compare to the national average?
What is the entry-level lawyer salary in Washington?
How many lawyers are employed in Washington?
Which Washington city offers the best value for lawyers?
Written by Alexandra Chen, JD
Career Analyst
Alexandra has 10 years of experience in corporate law. She specializes in mergers and acquisitions. Alexandra works at a mid-sized law firm in New York City.
Methodology & Data Source
Statewide salary figures on this page are 2026 projections based on the Bureau of Labor Statistics Occupational Employment and Wage Statistics (OEWS) survey, May 2026 release. A 4.70% compound annual growth rate (CAGR), derived from 6-year national BLS wage trends, was applied to each metro area's reported salary to estimate current 2026 lawyer compensation across Washington. State averages are employment-weighted across 50 metro areas — larger metro areas with more lawyerscontribute proportionally more to the average, producing figures that better reflect typical compensation. Individual pay varies by city, employer, certifications, and experience.
Data Sources & Methodology
Source: BLS, OEWS, 7-year dataset (–). Per-city data from annual BLS metropolitan area surveys.
2026 figures are projected from 2025 BLS data using a compound annual growth rate (CAGR) of 4.70%, derived from historical BLS wage trends for lawyers (SOC 23-1011).
Compiled and verified by Alexandra Chen, JD, a licensed lawyer with 10+ years of clinical experience. · View source data at BLS.gov